
My page just did 7 million views and $572 in 28 days — here’s the full breakdown
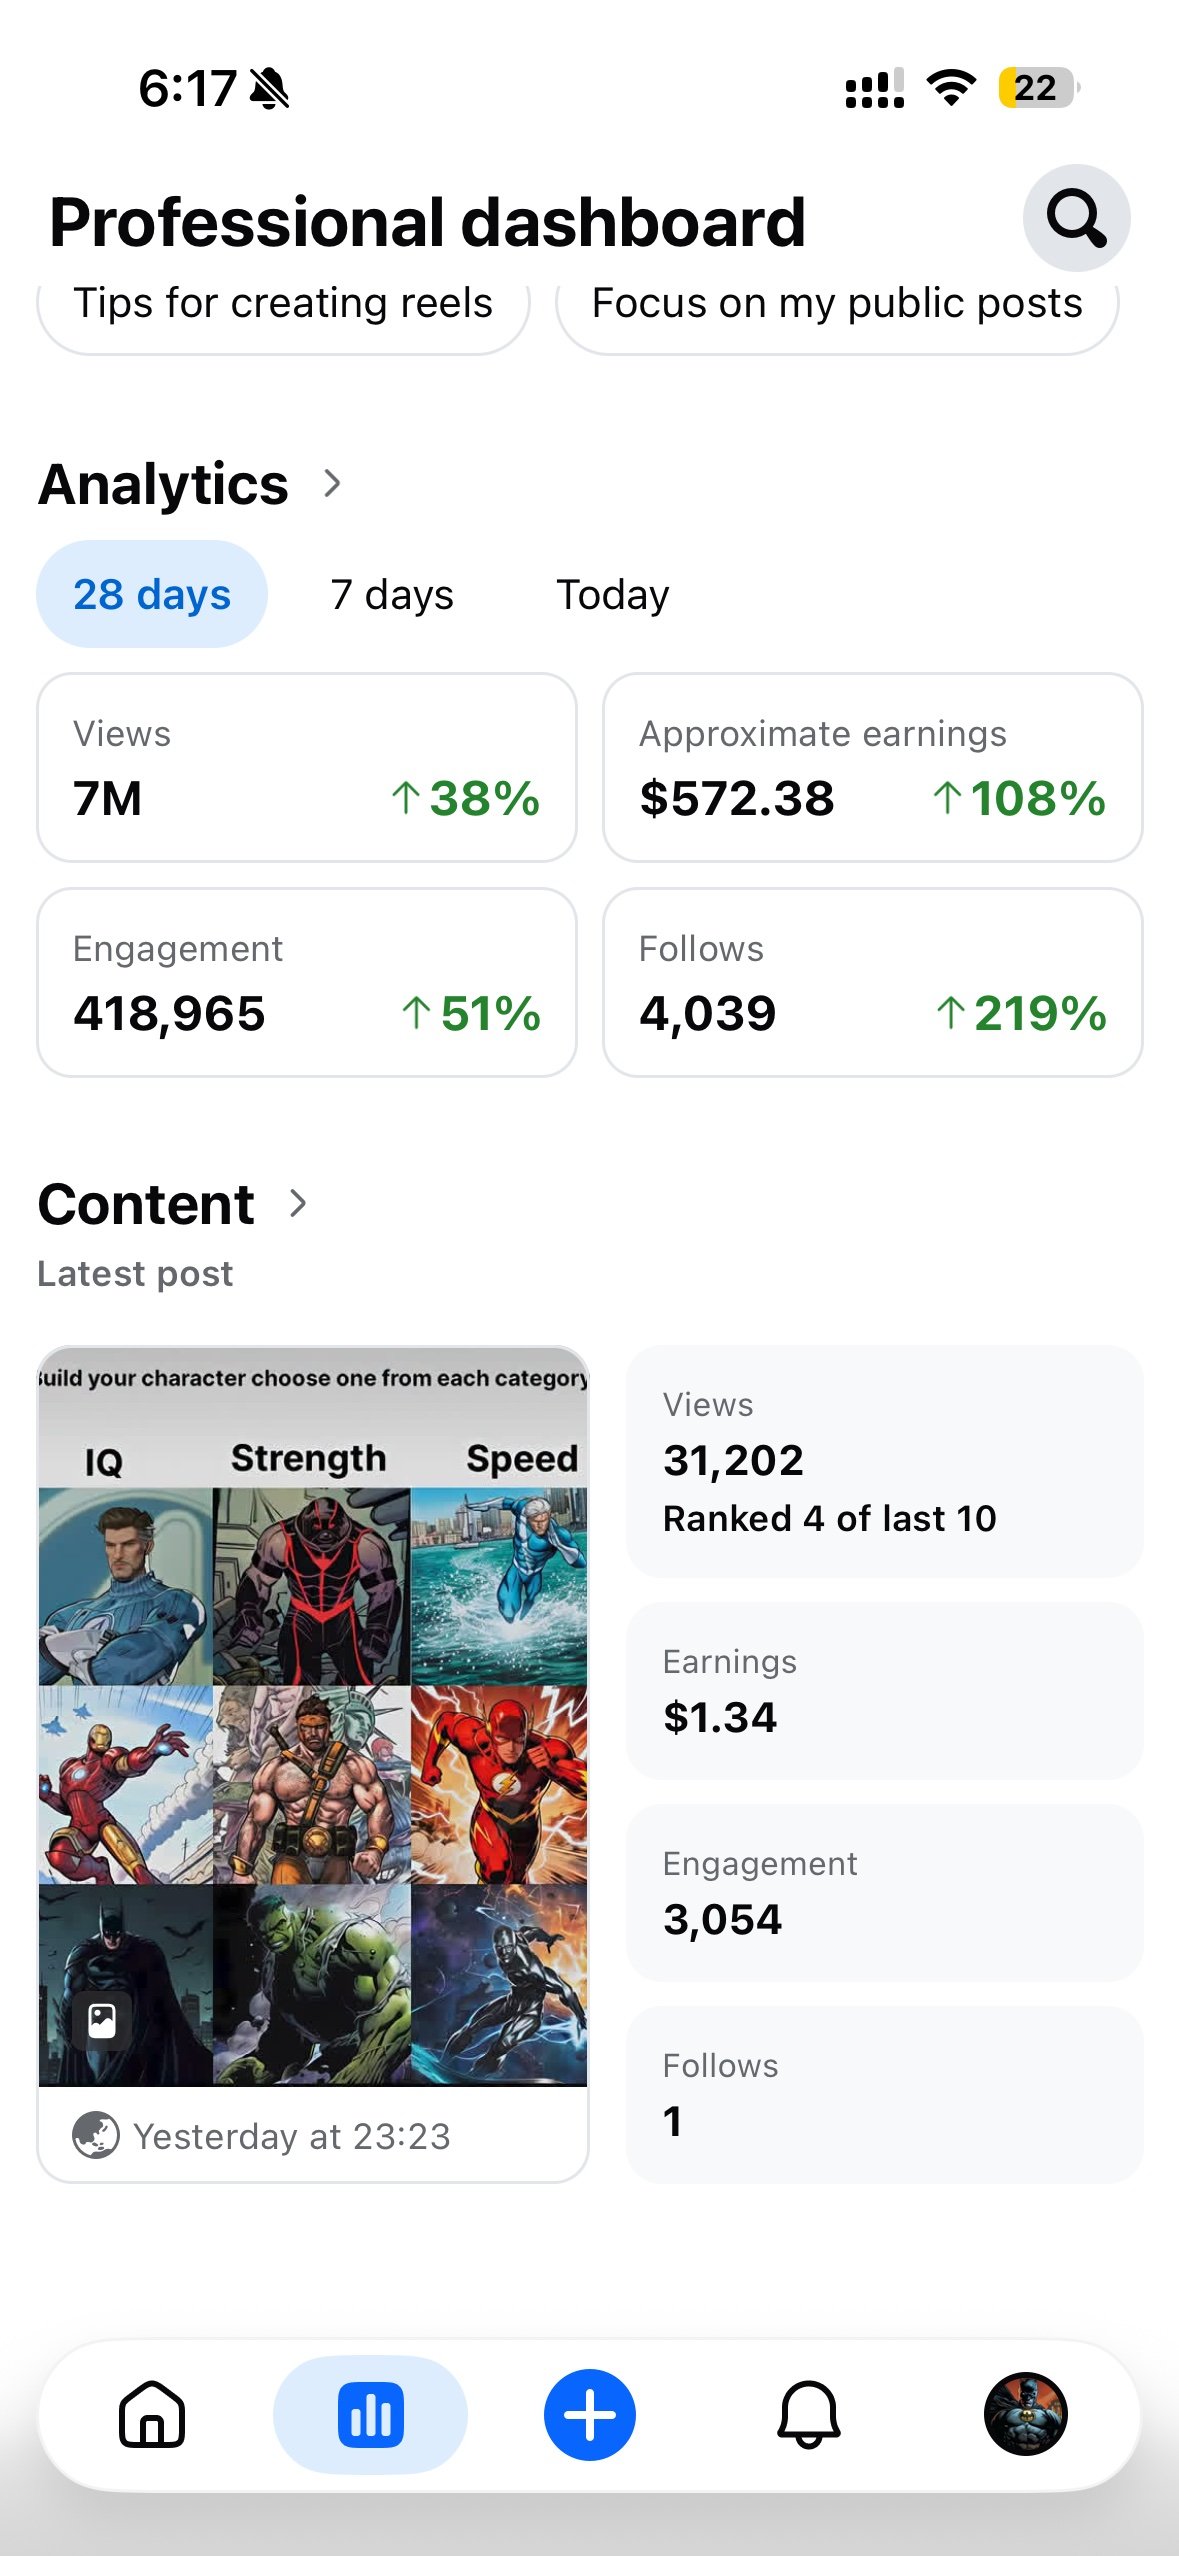
Here’s my actual Facebook Professional dashboard, last 28 days: 7M views (up 38%), $572.38 in approximate earnings (up 108%), 418,965 engagement (up 51%), and 4,039 new follows (up 219%). Below is the screenshot, straight from the app, plus what each of those numbers actually means — and the part most “7 million views!” posts conveniently skip.
A quick honesty note before we go further: this is one page’s documented 28 days. I’m not promising you’ll earn the same, and I’m not going to name the page. What I am going to do is walk through the real numbers, because creators almost never show them — and the gap between what people imagine 7M views pays and what it actually pays is the most useful thing in this post.
The four numbers, read one by one
Views: 7M, up 38%
Seven million views in 28 days. Sounds enormous — and it is a lot of attention. But on Facebook, “views” is the loosest metric on the dashboard. It counts every time a post appeared and registered a view, including quick scroll-pasts. It’s a distribution number, not an earnings number. The only honest use of the views figure is as context for everything below.
Approximate earnings: $572.38, up 108%
This is the number that matters, and notice Facebook’s own word: approximate. These are estimated earnings from the Content Monetization program, not a bank deposit. Payouts come later, on Meta’s payout schedule, after thresholds and verification are cleared.
Do the rough math with me: $572.38 divided by 7,000,000 views works out to roughly $0.08 per 1,000 views. That’s your headline RPM — eight cents per thousand. If you expected 7 million views to equal a new car, there’s your reality check.
Engagement: 418,965, up 51%
Reactions, comments, shares — the stuff that tells Facebook people actually care. Engagement growing faster than views (51% vs 38%) is the healthy signal in this whole dashboard. It means the audience isn’t just scrolling past; they’re stopping. If I had to pick one metric that predicts next month’s performance, it would be this one, not the view count.
Follows: 4,039, up 219%
This is the number I’m happiest about. Follows compound. Every new follower is someone Facebook may show my next post to without me having to “earn” distribution from scratch. A 219% jump in follows means the next 28 days start from a bigger base. Views are rented; follows are owned.
The detail everyone misses: earnings grew faster than views
Look at the two growth rates again: views up 38%, earnings up 108%. Earnings nearly tripled the pace of views. That only happens when the quality of the views improves — a bigger share of monetized views, better ad fill rates, or a more valuable audience mix (certain countries and niches carry higher ad rates).
This is the whole game on Facebook in 2026. Two pages can both do a million views and earn wildly different amounts, because Facebook pays on monetized views, not raw views. Geography, format, watch behavior, and advertiser demand all sit between your view count and your payout. I wrote a full breakdown of the mechanics and eight fixes that actually move RPM over at facebook-rpm-low-how-to-increase-2026 — read that next if your RPM looks thin, because this post is the proof that the mechanics there describe a real page.
Even the “latest post” card tells a story
The screenshot also shows my latest post at the time: an image post (a character-grid meme) that pulled 31,202 views, $1.34 in earnings, 3,054 engagement, and 1 follow, ranked 4th out of my last 10 posts. Notice the ratio: 31K views turned into $1.34. Image posts earn at a fraction of video rates — that’s normal, not a bug. They exist to keep the page active and feed the algorithm between bigger pieces, not to pay the bills directly.
That single post is also a useful reminder not to judge a page by one post. Ranked 4 of 10 means six posts did better and three did worse. The page’s earnings come from volume across dozens of posts, not from one viral hit.
What I’m not doing with these numbers
I’m not changing my strategy based on one good month. One 28-day window doesn’t prove a formula — it proves the page is healthy right now. What I am doing:
- Watching the follows number, not the views number. If follows keep climbing, distribution compounds. If views spike but follows stall, the growth is borrowed and will fade.
- Keeping the format mix that produced this. The dashboard shows a blend of posts doing the work, not one lucky reel. Volume plus consistency beats chasing one viral format.
- Treating the earnings as approximate until payout. Dashboard estimates and bank deposits are two different things. Thresholds, payout schedules, and tax forms all stand between that $572.38 and my account.
And one thing I’m explicitly not claiming: I don’t know exactly why earnings outpaced views this month, and anyone who tells you they can isolate that variable on Facebook is guessing. The platform doesn’t show per-view ad rates. I can see the result; the mechanism is Meta’s black box.
Why I’m showing you this at all
Because the creator economy runs on two kinds of lies: gurus who show rented dashboards, and skeptics who say “Facebook doesn’t pay.” The truth is boring and in the middle. Facebook does pay — $572.38 in 28 days is real money from one page — but the pay-per-view math is brutally honest: roughly eight cents per thousand views, and only the monetized fraction counts.
I showed the same kind of honest math for my music income, where my real DistroKid dashboard came out to $414.44 withdrawn — not the $950 headline. Same principle applies here: real numbers, no rounding into a better story.
If your page is doing a fraction of these views, don’t be discouraged — be mechanical. Check your RPM first, fix the format mix, and give it months. One documented month beats a hundred motivational posts.
Frequently Asked Questions
How much does Facebook pay per 1,000 views in 2026?
Based on this page’s actual dashboard — $572.38 across 7M views — the rough headline figure is about $0.08 per 1,000 views. But that blends all formats and includes non-monetized views; your real rate depends on monetized views, audience country, and format. My full RPM breakdown with eight fixes is here: facebook-rpm-low-how-to-increase-2026.
Are Facebook’s “approximate earnings” the same as what gets paid out?
No. The dashboard shows estimated earnings from the Content Monetization program. Actual payouts follow Meta’s payout schedule and require your payout account, tax forms, and identity verification to be complete — plus meeting the payout threshold. Meta’s official line on what keeps a page eligible is its Partner Monetization Policies — authentic content, no manufactured engagement, no misinformation.
Why did earnings grow faster than views (+108% vs +38%)?
Almost certainly a higher share of monetized views or better ad fill in that window — but Facebook doesn’t show per-view ad rates, so the exact cause is Meta’s black box. The honest read: view quality improved, not just view quantity.
Do image posts earn money on Facebook?
Yes, but at much lower rates than video. My latest image post did 31,202 views for $1.34. Image posts are better thought of as engagement and consistency tools that keep the page active between higher-earning pieces.
Which metric should I watch most — views, earnings, or follows?
Follows, for growth. Views tell you about distribution this month; follows tell you about distribution next month. Earnings are the scoreboard, but they’re a lagging indicator — they follow the other two.
Can I replicate these exact numbers?
Nobody can promise that — not me, and not any course seller. This is one page’s documented 28 days, with its own audience, niche, and history. Use it as a benchmark for what’s realistic (about eight cents per thousand views), not as a guarantee.