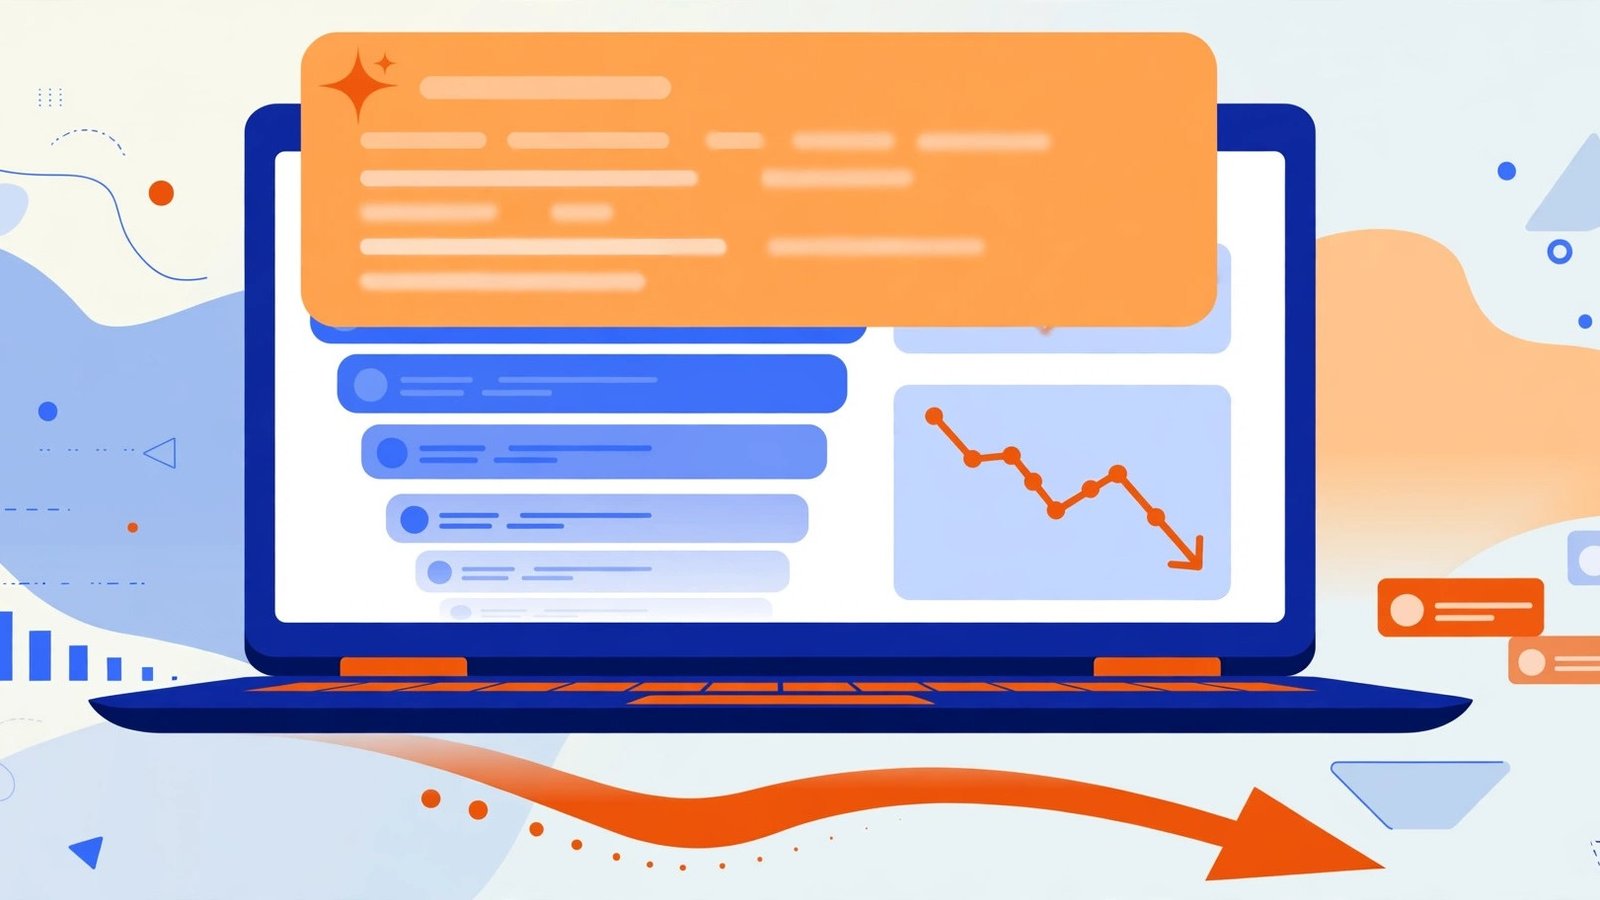
For two years, publishers watched their Google traffic slide while Google answered that the slide was correlation, not causation. That defense just got a lot harder to sustain. A randomized field experiment found that when a Google AI Overview appears on a results page, outbound clicks to ordinary websites fall by 39.8%, and searches ending with no click at all rise by 34.5%.
That’s not another traffic chart sloping downward next to an AI rollout timeline. It’s a controlled experiment: one group of real users saw Google as usual, another group had AI Overviews hidden by a browser extension, and everything else stayed the same. The gap between those two groups is the closest thing the SEO world has ever had to a causal number for AI Overviews. If you run a blog, a news site, or any site that depends on search visitors, this number — and its limits — should reshape how you plan content for 2026 and beyond.
What the experiment actually did
The study is “The Impact of Google AI Overviews on Publisher Traffic and User Experience,” by Saharsh Agarwal of the Indian School of Business and Ananya Sen of Carnegie Mellon University. It was posted to SSRN in April 2026 and revised in July 2026, and the authors label it a preliminary draft — a detail worth keeping in mind, because it means the paper hasn’t finished peer review yet.
Here’s the design, in plain terms. The researchers recruited 1,065 desktop Chrome users in the United States who agreed to install a browser extension for two weeks in January and February 2026. Users were randomly assigned to groups. The control group saw Google exactly as usual. The treatment group had AI Overviews removed in real time, with the remaining results shifting up to fill the space. A third, exploratory group was redirected to Google’s AI Mode interface instead.
Random assignment is the whole ballgame here. In every earlier study of AI Overviews, researchers compared searches that triggered an Overview with searches that didn’t — but those two kinds of searches differ in lots of ways besides the Overview itself. Maybe Overview-triggering queries are simply the kind people don’t need to click for. Randomly hiding the Overview for some users and not others strips that problem away. If clicks rise when the Overview disappears, the Overview was causing the loss, not merely sitting next to it. And that’s what happened.
The study was preregistered in the AEA RCT Registry and approved by the Indian School of Business ethics board, which means the researchers wrote down their analysis plan before seeing the results. That’s a good sign: it makes it harder to quietly fish for the most dramatic number after the fact.
The numbers that matter
The headline figures only make sense together, so here’s the full set:
| What was measured | Result |
|---|---|
| Outbound organic clicks when an Overview appeared | Down 39.8% |
| Searches ending with zero clicks | Up 34.5% |
| Outbound clicks per search, Overview hidden vs. shown | 0.62 vs. 0.37 |
| Effect spread across all searches (Overviews appeared on ~41% of in-sample queries) | Roughly 18.5% fewer outbound clicks overall |
| Clicks on sponsored links | No change |
| Search frequency (how often users searched) | No change |
| Satisfaction, perceived quality, ease of finding information | No difference between groups |
| Engagement after clicking (time on site, bounce, return to results) | No measurable difference |
A few of these deserve unpacking, because the headlines floating around social media flatten them.
First, the 39.8% applies to searches where an Overview actually appeared — not to all of your traffic. Spread across every search in the sample, including the ones with no Overview, the effect works out to about 18.5% fewer outbound clicks. Neither number is “your site lost 40% of its traffic.” Your loss depends on how often your queries trigger Overviews, which positions you hold, and what kind of queries you rank for.
Second, the clicks that came back when Overviews were hidden were concentrated at the top of the page. Positions one, two, and three gained the most. That fits the layout reality every SEO has felt since Overviews expanded: the AI answer sits above the organic results, so the top organic listings absorb the biggest hit. Ranking fourth instead of first used to cost you some traffic; in an Overview world, it can cost you nearly all of it.
Third, sponsored clicks didn’t move, and people didn’t search less. The Overview doesn’t shrink Google usage — it reroutes the value of a search away from organic publishers while leaving Google’s own ad business untouched. That’s the detail publishers keep coming back to, because it answers the “maybe users just search differently now” objection. Users searched just as much. They just clicked out less.
Fourth — and this one cuts against the publishers’ own narrative — the clicks that did survive were just as good. People who clicked through from an Overview page spent similar time on the destination site, bounced at similar rates, and returned to the results page at similar rates. And users reported no difference in satisfaction whether Overviews were shown or hidden. Google’s claim that Overviews send “higher quality” clicks has some support here, at least on engagement measures. What the experiment doesn’t support is the stronger claim that total click volume is fine. It isn’t.
Why “causal” changes the argument
Before this experiment, the evidence was a pile of correlations, each individually explainable away. Pew Research Center’s July 2025 study of real browsing behavior found users clicked a traditional result in about 8% of visits when an AI summary appeared, versus about 15% when none appeared. Ahrefs measured a 58% lower click-through rate for the top-ranking page on queries that trigger an Overview — nearly double the effect it found in April 2025. Chartbeat’s 2026 Publisher Playbook found Google Search referrals to news and media sites fell 40.2% between July 2025 and July 2026.
Every one of those findings had a ready reply: different queries, different users, different time periods. The randomized experiment removes the reply. Same users, same queries, same two weeks — the only difference was whether the Overview was there. When it was, clicks fell by two-fifths.
There’s also a second, separate experiment worth knowing about, because it shows where this road leads. Researchers at the University of Pennsylvania and Northeastern ran a preregistered study of about 1,100 users pushed into Google’s AI Mode, the more aggressive conversational interface. Directing users into AI Mode cut the share of searches ending in an external visit by 18.8 percentage points. Unlike the Overview experiment, that study found AI Mode lowered user satisfaction, usefulness, and trust in Google. One caveat the researchers themselves flag: AI Mode made up only 0.6% of participants’ searches before the study, so the experiment shows what happens if AI Mode becomes the default, not what happens when users choose it.
The 80% milestone: Overviews are now the default experience
The experiment measured a world where Overviews appeared on about 41% of the sample’s queries in January and February 2026. That world is already gone. Search Engine Roundtable’s October 26, 2026 roundup of tracker data put AI Overviews on more than 80% of Google searches: Semrush measured 88% of 400 tracked commercial keywords in August 2026 (97% when weighted by search volume), and SE Ranking measured 82.5% of US brand searches. That’s up from roughly 50% in June 2025 and about 15% a year earlier.
Do the rough math on what that means. If the causal effect per Overview search is ~40% and Overviews now appear on ~80% of searches instead of 41%, the blended drag on outbound clicks is much larger than the 18.5% the experiment computed for its own sample — potentially in the 30% range for heavily affected query types. That’s my arithmetic, not the study’s finding, and it assumes the per-search effect stays constant as Overviews expand to new query types, which it may not. But the direction is clear: the experiment’s sample understates today’s exposure, not the reverse.
There’s a related wrinkle from the same November webmaster report: Google has stopped sharing AI Overview click data in some reports, and may be testing the removal of citation cards from some Overview results. If citations get harder to earn or see, the gap between “being used as a source” and “being visited” widens further.
Reddit’s million-a-week warning
The experiment landed in the same weeks as a real-world data point from one of the web’s biggest publishers. On Reddit’s third-quarter 2026 earnings call on October 29, 2026, CEO Steve Huffman said the platform had received more than one million fewer Google search referrals per week on average during October, and pointed to Google’s AI search experiences as a suspected contributor. As reported from the call, his blunt assessment was: “AI Mode does not drive traffic. Not for us, and not to anybody as far as I know.”
Handle that quote with care, because Huffman himself flagged the limits. Reddit also believes its machine-translated content may be ranking lower, particularly outside the United States, and the company hasn’t established how much each factor contributed. A million fewer weekly referrals is Reddit’s reported figure; attributing all of it to AI Overviews would go beyond what the evidence supports. But as a signpost it matters: even a platform with 130.3 million daily active users and a paid data-licensing deal with Google is feeling the referral squeeze in public, on an earnings call, in numbers.
The broader publisher picture points the same way. The Wall Street Journal’s reporting on Semrush data put traffic declines from June 2025 to June 2026 at 28% for USA Today, 35% for Reuters, and 43% for Business Insider, with Reach plc down 55% year over year. Those are observational figures, not causal ones — but stacked next to a randomized 39.8%, they stop looking like coincidence.
What the study does not prove
Honest reporting means stating the limits as plainly as the findings, because overclaiming here hands Google an easy rebuttal:
- Desktop only, US only. All 1,065 participants were US desktop Chrome users. Mobile behavior — where a huge share of searches now happen — may differ, and the study says nothing about it.
- A January–February window. Overviews have changed since: Google expanded them to fully expanded layouts in August 2026, pushing organic links further down the page. The measured effect could be larger now, or different in kind.
- A preprint, not a peer-reviewed paper. The authors call it a preliminary draft. The numbers may move in revision, as they already did once: an earlier version was widely reported as showing a 38% cut, with the revision landing at 39.8%.
- Volunteers with a tracking extension. People willing to install a research extension aren’t a perfect mirror of all searchers.
- Not a site-level forecast. A 39.8% drop on Overview searches is not a prediction that your site loses 39.8% of its traffic. Your exposure depends on your query mix. Brand searches, transactional queries, and queries where your content offers something the Overview can’t summarize are far more sheltered than generic informational queries.
If someone tells you “Google now steals 40% of everyone’s traffic,” they’re misreading this study. If someone tells you “there’s still no proof Overviews cost clicks,” they’re ignoring it.
The publisher playbook: what to do about a causal 40%
So what actually changes in your content strategy? I’ve been thinking about this in terms of one question: what reason does a searcher have to click when the answer is already on the results page? Every tactic below is an answer to that question.
1. Win the queries where the Overview can’t finish the job
Brand queries and transactional queries survive best. Someone searching for your product, your pricing, or your specific tool can’t get what they need from a generic summary. Informational queries — “what is X,” “how does Y work” — are the most exposed, because the Overview can answer them completely. That doesn’t mean abandoning informational content; it means informational content needs a second layer the Overview can’t reproduce (see point 3).
2. Publish things that can’t be summarized away
Original data, original tools, original downloads, and original experiences are the click moat. A comparison table built from prices you actually checked, a calculator, a template download, a test you ran yourself — none of these fit neatly into a paragraph summary, and all of them give a searcher a reason to leave Google. Pure rewrites of what everyone already says are the most summarizable content on the web, and therefore the most doomed. If your article adds nothing that isn’t already in the top five results, an Overview will eventually eat it whole.
3. Write for citation AND for the click
There’s a tension here worth naming. To be cited in an Overview, your content needs clear, quotable, factual statements — the direct answer up front, named entities, verifiable numbers. To earn the click, it needs something beyond the quotable answer. The practical balance: put the direct answer in the first paragraph (that’s how you get cited and how you serve readers), then make the rest of the article genuinely deeper than any summary could be — worked examples, edge cases, decision frameworks, the “here’s where this goes wrong” section. The Overview can quote your conclusion; it can’t reproduce your judgment.
4. Don’t opt out in a panic
We’ve covered the opt-out question separately on this site, including the finding that opting out of AI Overviews costs a site nearly all of its Overview-driven visibility (our earlier piece on the 0.9% click-through rate and the opt-out trade-off walks through that math). Google uses one crawler for both classic search and Overview generation, so there’s no selective “index me but don’t summarize me” switch today. Blocking Google outright is an all-or-nothing move no major publisher has actually executed at scale. The experiment’s numbers are grim, but a site with 60% of its former Google traffic still beats a site with none of it.
5. Measure the right thing, and diversify the rest
If you only watch total Google sessions, you’ll misread what’s happening. Split your Search Console data by query type — brand vs. non-brand, informational vs. transactional — and watch impressions versus clicks separately. Rising impressions with falling clicks is the signature of the Overview era: you’re being read, just not visited. And then do the unglamorous work the experiment implies: build traffic you own. Email lists, direct visits, RSS and app audiences, social followings that actually convert — none of these depend on a results page you don’t control. Reddit’s response is instructive here too: the company is moving toward a primarily logged-in experience, testing login walls in select markets. You don’t need to go that far, but every reader you convert from “Google sent them once” to “they come back on their own” is a reader the Overview can’t take from you.
6. A worked example: what 40% means for a real blog
Let’s make this concrete with clearly labeled scenario math — not a forecast, just a way to feel the size of the number. Imagine a blog getting 10,000 organic visits a month from informational queries. If Overviews appear on 80% of those queries, about 8,000 visits’ worth of searches now carry an Overview. Apply the experiment’s 39.8% click reduction to that exposed share, and the blog keeps roughly 6,800 of its original 10,000 visits from that segment — a 32% overall haircut on informational traffic, before any other factor. Now imagine the same blog also has 5,000 monthly visits from brand and transactional queries where Overviews rarely change behavior. Its total falls from 15,000 to about 11,800 — a 21% overall decline. The same causal effect produces very different outcomes depending on query mix, which is exactly why “it depends on your content” isn’t a dodge here. It’s the whole story.
The bottom line
For two years the debate was stuck on whether AI Overviews cost publishers clicks or merely coincided with traffic declines. A randomized experiment with 1,065 real users has now answered that question: where Overviews appear, outbound clicks fall by about two-fifths, zero-click searches rise by about a third, and the clicks that return when Overviews are hidden are real, engaged visits — not junk traffic. The study is a preliminary draft, desktop-only, and US-only, and none of that erases its central finding.
The strategic conclusion isn’t despair, and it isn’t denial. It’s specificity. Generic informational content that an Overview can fully answer is a depreciating asset. Content with original data, tools, judgment, and a reason to click is the asset that survives. The publishers who adapt to that reality — citing-friendly up front, irreplaceable underneath, and less dependent on any single traffic source — are the ones still standing when the next tracker report shows Overviews on 90% of searches.
For more on the trade-offs around opting out of Overviews, see our earlier analysis of the 0.9% click-through rate and the opt-out halo effect, and for how Overview link prominence has shifted, see our piece on Google’s prominent-links changes for publishers. External context for this article includes the November 2026 analysis of the causal experiment and Google’s own August 2025 post on AI search and click quality.
Frequently Asked Questions
Does the 39.8% figure mean my site will lose 40% of its traffic?
No. The 39.8% drop applies to outbound clicks on searches where an AI Overview appeared. Your total traffic loss depends on what share of your queries trigger Overviews and what kind of queries they are. Brand and transactional traffic is far less affected than generic informational traffic.
Is the study peer-reviewed?
Not yet. Agarwal and Sen’s paper is a preliminary draft posted to SSRN in April 2026 and revised in July 2026. It was preregistered and ethics-approved, which strengthens it, but the numbers could still move in peer review — as they already did once, from 38% to 39.8%.
Did users like the searches with AI Overviews better?
In this experiment, no measurable difference showed up: the closing survey found no difference in satisfaction, perceived quality, or ease of finding information between users who saw Overviews and users who had them hidden. Separately, the Penn–Northeastern AI Mode experiment did find lower satisfaction, usefulness, and trust — but that tested the more aggressive AI Mode interface, not standard Overviews.
Does opting out of AI Overviews fix the problem?
Probably not, and it may make things worse. Google uses one crawler for classic search and Overview generation, so there’s no selective opt-out that keeps your rankings while removing your summaries. Our earlier opt-out analysis walks through why the trade-off usually costs more traffic than it saves.
Are AI Overviews on every search now?
Not every search, but close to it by tracker measures: over 80% of searches in the October 2026 roundup, up from about 50% in June 2025 and roughly 15% a year before that. The experiment itself measured a 41% prevalence in January–February 2026, so today’s exposure is substantially higher than the study’s sample.
What kind of content still earns clicks in the Overview era?
Content that offers something a summary can’t reproduce: original data or testing, interactive tools and calculators, downloadable templates, detailed worked examples, and expert judgment on edge cases and trade-offs. The direct answer up front helps you get cited; the depth underneath is what earns the click.